Author: lapaasindia

  • 5 Practical Steps To Conduct A Good What-If Analysis Process

    5 Practical Steps To Conduct A Good What-If Analysis Process

    Do you get confused while taking major decisions in business or anywhere in life? Like you want to buy a mobile phone, but there are so many brands available in the market, and because of that you are confused.

    So these types of all types of confusing situation’s solutions we can easily find by doing a what-if scenario analysis.

    What-if analysis is a process that a business or anyone can use to make a better decision. 

    And here I will discuss, all what-if analysis, and that will help you in both your professional and personal life. 

    WHAT’S IN IT

    Definition of What-if analysis

    What-If Analysis

    What-if analysis is a process where we can input different values for different scenarios and predict what can happen in the feature, by asking questions like, what will happen if I do this, what will happen if I do that. 

    It helps us to make better decisions quickly and easily.

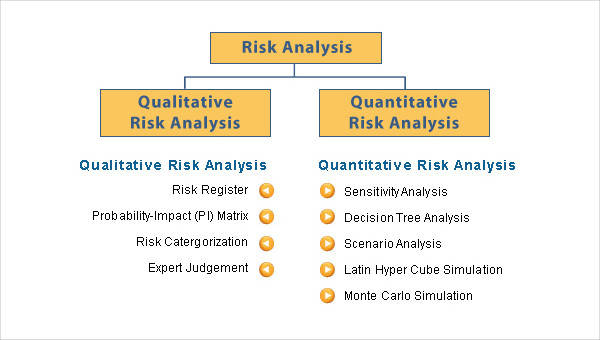
    The what-if analysis takes the help of sensitivity analysis and scenario analysis to give us a result.

    The sensitivity is a process where the decision-makers tweak one of the critical inputs and observe how sensitive that model is.

    And the scenario analysis is a process where they list a series of inputs and calculate the effectiveness of the model by changing each input.

    And finally, the what-if analysis where we can ask what-if questions and those questions answered by the sensitivities and scenarios.

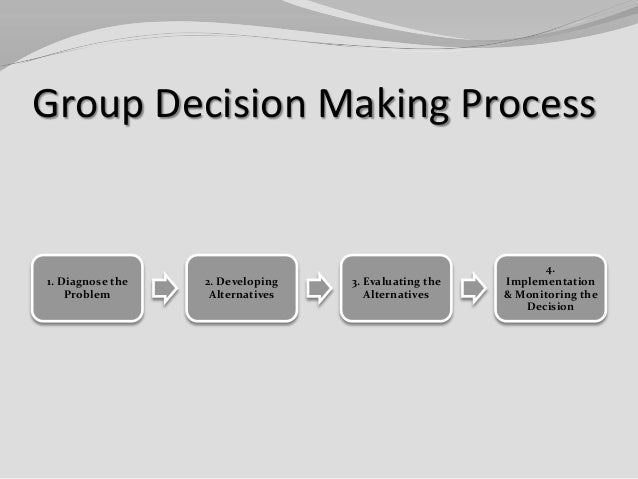
    Steps to Conduct What-if Analysis

    There are five steps available to conduct what-if analysis.

    Step 1: Make a Team

    Before starting the process, we have to make an excellent team of potential people. The team members should not assume anything in advance so that at the time of brainstorming, they can see the reality or previous data as it is and make their decisions. 

    Step 2: Develop what-if questions

    After making a good team next, we have to develop what-if questions with the team. The questions should be related to the problem, and it should have the potential to determine the advantages, disadvantages and the risks of the project. 

    Like if we do this, then what advantages and disadvantages we will get from this.

    Step 3: Calculation of risks

    After developing all the what-if questions now the time is to calculate, what possible risks they have. We should observe all the questions deeply and assess all the possible risks by making different scenarios. 

    Step 4: Recommendations

    After calculating the possible risks, then the team selects some scenarios which have low risks. And then they select scenarios which have a strong potential to grow the business and leave others.

    Step 5: Evaluation

    After that, we have to evaluate whether what we choose is working according to our assumption or not. If it is working what we assume, then it’s okay. Otherwise, we have to select another scenario. 

    Example

    How to trade in options with examplewww.nad.org.tw

    Let’s take the example of a company which tries to launch a new product to the market. 

    Now do a what-if analysis for their new product and find the best way to make it more profitable.

    If we are launching a product, then there are many other methods also available to calculate the product’s success factor. Like we have to see what’s the demand for the product, what kind of product’s people like most, etc. by doing marketing research.

    And among them, what-if analysis is also a part of that and from which we can assume many things about its success.

    After making a good, we have to prepare the right questions. Because in a what-if analysis making good questions is essential.

    We can make questions by observing all scenarios.

    We have to make scenarios and questions like if we launch our product only in rural areas then what happens? If we lunch only in urban areas, then what happens? If we price it high, then what happens? And if we price it low then what happens? Etc.

    So we have to make questions by our goals, what we want to achieve from that product. And that also determines the action’s advantages and disadvantages.

    After that, we may select some scenarios between them, and if it matches to our desired goal, then we can select that. 

    Benefits of what-if analysis

    Doing a proper what-if analysis is very beneficial for your business or decision making. It increases your decision-making process. 

    Because when we conduct what-if analysis, then we assume all the scenarios and know all future happening effects of our current activities. 

    So it also gives us the confidence to make the right decision. 

    Let’s go back to our previous example of product launch and see what feature advantages and disadvantages it gives.

    By analysing we can know in which market we have to launch our product to earn a good profit.

    We can know when we are increasing and decrease the price then how our audience reacts towards our business.

    So whenever we have to make big decisions, then we must have to conduct what-if analysis to make a better and faster decision.

    Tools for Modeling What-if Analysis

    What-If Analysis

    There are many tools available for modelling this what-if analysis.

    Manual scenario

    We can make this tool by using formulas and dropdown boxes. And it is a common scenario. 

    If we do it correctly, then we can get better results from it. First, we can put our data by using formulas and dropdowns, and then we can make different. 

    Scenarios

    If we change one of our data, then that reflects in the scenarios.

    But we should not use so many scenarios for a model. 

    Because if we use so many, then it may confuse us instead of giving the results.

    And at least we can use three types of scenarios best case, base case, and worst-case scenarios.  

    And after that, we can use according to our requirements.

    Data table

    This we can use when we have a single output and one or two inputs.

    Like we sell one product and want to calculate the profit then we can use this.

    We have to input the product’s selling price and the cost of that product as input. And we have to put the subtraction formula from selling price to cost then we can find the profit as output.

    Conclusion

    If you have a small business then also you can use this what-if analysis. By using this method, you also can make fast your decision-making process. 

    In a small business, you need to make a big team for this process; you can also use Microsoft excel and calculate it easily.

    You can make different scenarios in the Microsoft Excel sheet, and by implementing formulas and changing values, you can calculate what-if analysis.

    But when your business grows, then you have to make or hire a good team for this process. And by collecting data and analysing them, you can calculate the what-if values.

    And you can also use the previously used data to compare present’s situations. You can use different software also to conduct this process.

    FAQ’S

  • Equipping Your Team To Make Decisions Is A Great Way To Increase Your Profit!

    Equipping Your Team To Make Decisions Is A Great Way To Increase Your Profit!

    Firstly, We can use the term ‘team’ to refer to groups and organizations. Hence, Teamwork involves working with each other to achieve something beyond the capabilities of individuals working alone.

    Employee empowerment is also a critical strategy that enables people to make decisions about how to serve customers best, give them answers and knowledge.

    WHAT’S IN IT

    Decision-making in group

    Group Decision Making

    Many group decision-making meetings destroy before they even begin. So, Absent employees, missing information in the team arrangement can ruin the decision-making process.

    Hence, For the decision-making process, you can involve the right people in the correct position to complete the work. So, Every employee has a different type of perspective and a different mindset about work.

    Therefore, Every employee can come to the group meeting and ready to discuss questions, information, and risk involved in the organization.

    Provide essential information in advance before we can start the decision-making process. 

    And then tell everyone that comes with preparation of proposed ideas and solutions.

    So, Mainly, Give a chance to every employee to share their ideas and solutions to make the decisions.

    Team Dynamics

    Hence, Team dynamics refers to the design of interactions that appear as groups develop. These interactions are also called group processes.

    Problem Solving

    A problem exists whenever there is a difference between what is happening and what we want to be happening.

    If your objective is to produce 500 units a day, but only 475 are provided, you have a problem. Individuals typically try to reduce the disparity between the actual performance and the objective.

    Thus problem-solving is the process of taking corrective action to meet objectives. Decision-making is the process of selecting an alternative course of action that will help solve the problem. Decisions must be made when you have to face a challenge or opportunity. When making decisions remember the goal of human relations is to create win-win situations for everyone.

    Decision-making styles

    Impact of Individual Decision-making Styles on Marketing Information System  Based Decision-making - Research leap

    Following are different decision-making styles which include reflexive, consistent and reflective 

    Reflexive

    Reflexive decision-maker likes to make quick decisions, without taking the time to get all the information that might be needed and without considering all the alternatives.

    On the positive side, reflexive decision-makers are decisive. In a negative situation, making quick decisions when a decision is not the best choice can lead to futility and repetition.

    If you use our reflexive style, you might want to slow down and spend more time gathering information and analyzing alternatives. 

    Reflective

    A reflective decision-maker likes to take plenty of time to make decisions taking into account considerable amounts of information and analyzing several alternatives. 

    On the positive side, the reflective type does not make decisions that are used. On the negative decisions, they may procrastinate and waste valuable time and resources and lose opportunities. 

    The reflective decision-maker may be viewed as wishy-washy in indecisive. If you use the reflective style, you might want to speed up your decision making.

    Consistent

    A consistent decision-maker makes decisions without rushing or wasting time. Consistent decision-makers know to make a good decision we have enough information and options. They have the most consistent record of the right decisions. consistent decision-makers follow the decision making steps provided in the decision-making model.

    The Decision Making Model

    We all like to think that we are intelligent and have great intuitive judgment when making decisions. However, research shows us that people are far from balanced and often act against their own best interests and that intuitive judgment is often flawed and doesn’t help us make the right decisions.

    decision-making can be more rational when following a process like this decision-making model. Of course, we all have to use some intuitive judgment. But using the model helps us be more rational and focus intuition and analysis along the way. 

    Steps of Decision Making Model

    Decision-making process | UMass Dartmouth

    step 1 – Define the problem 

    If you miss diagnosing the problem, you will never solve it. So slow down and focus only on defining the problem because when our attention is scattered, we tend to miss understand or miss estimate what we face.

    In analyzing the problem first, distinguish the symptoms from the cause of the problem to do so list the observable and describable occurrences the signs that indicate that a problem exists. 

    step2 – set objectives and criteria 

    After you have defined the problem, you set an objective. The result of the decision to solve the problem. Identify the criteria the decision must meet to achieve the goal.

    step 3 – generate alternatives 

    You need to generate possible ways or options to solve the problem by making a decision. There are usually several ways to solve the problem. If you don’t have more than two options, you don’t have to make a decision. When making non-routine decisions, new creative solutions are often needed to generate alternatives.

    step 4 – analyze alternatives

    Analyze alternatives and select one. Here you must evaluate each option in terms of the objectives and criteria you’ve set. Try to avoid distractions that can lead to poor choices. 

    step 5 – plan to implement the decision and control

    Finally, the decision and control- that’s three separate parts as the title states. After making the decision, you should develop a plan of action with an implementation schedule.

    A common reason for not implementing a decision is a lack of planning. Decision-making is a waste of time if you don’t apply the alternative. As with all plans, controls should be developed well planning. 

    Checkpoints with feedback should be estimated to determine if the decision is solving the problem. If not, corrective action may be needed. You should not be locked into an irrational escalation of commitment to a decision that does not solve a problem. When you make a poor decision, you should admit the mistake and change it by going back to the previous steps of our decision-making model.

    Conclusion

    Every organization has consisted of various types of problems, and it is necessary to take the corrective decision to solve this problem.

    In this blog, You can see how to prepare a team to make decisions whenever necessary.

    You can also read the decision making styles, such as reflexive, consistent, and reflective. The decision-making model is used to create a judgment for the decision making process.

    Also you can read our blog on 3 Things That You Never Expect On Self Preparation For Great Decision Making.

    FAQ’s

  • 3 Things That You Never Expect On Self Preparation For Great Decision Making.

    3 Things That You Never Expect On Self Preparation For Great Decision Making.

    Decision-making is an integral part of being a human, we all are learning this skill since we are little kids, deciding whether to choose chocolate or vegetables, play games, or study.

    As we grow older, the decisions that we make become more complicated. At that time, the consequences become more serious.

    I don’t have to tell you that the decisions you’re making today will determine your future. And how you invest your time today, that will determine how quickly you will achieve your goals.

    But decision-making is not an easy thing because if it were then, people wouldn’t be making so many bad decisions. It’s not that people want to make bad decisions, but it just happens that there are all these emotional triggers and noise.

    When we make decisions, we end up making poor decisions, so before we dive into the concepts and strategies to improve our decision-making skills.

    WHAT’S IN IT

    Why people are making poor decisions?

    Self Decision Making

    The following are some of the main reasons why people are making poor decisions?

    Incomplete or False Information

    We now live in the Internet age, where information is available to almost everybody. So the problem is that information, for the most part, is uncontrolled. It means that anyone can post whatever they want. So when you do your research, you might come across information that is not true. These work hand to hand with confirmation bias.

    Confirmation Bias

    Confirmation bias refers to our tendency to search for and information that confirms our beliefs. When simultaneously ignoring or devaluing the information that contradicts our beliefs.

    Emotions

    All humans are emotional creatures. They are sensitive, and that’s why marketers are using emotions to influence our buying decisions, and as you have probably noticed, it works. A lot of times we buy stuff that we don’t need. It is also common to get emotionally attached.

    For example, I have a friend. We all call him Rohit. Rohit is a good friend of mine, and I like and respect him. Rohit doesn’t know it, but he has a huge influence on me. 

    One day Rohit starts to smoke and tells me that it’s cool to smoke, all the cool kids do that because I respect him, I believe that what he was saying is true, I will probably start to smoke as well even if I think that it’s not healthy and good for me.

    Rush and Hurry 

    We are living in a constant hurry. We have deadlines to meet, and we are busy all the time. So it’s no wonder that one of the biggest problems in decision-making is rush decisions that we later have to regret. 

    At first, it might seem like there is not much we can do with our deadlines, but usually, people themselves create situations where they have to make rash decisions.

    For example, If my boss asked me to prepare a presentation about market research. In most cases, he will give me some time to do the research. it’s unlikely that he will suddenly from thinner want a presentation in the next three hours, I might be given a week or at least a couple of days to do proper research and come up with a good action plan.

    In this case, we will use the week as an example. So at the point of getting tasks, it seems reasonable to prepare the presentation in one week. So if I think it will take me 10 hours to make everything, I can easily spend 2 hours each day. And by the end of the week, I will have the job done. 

    But most people will not do that. Most people will delay till the last day and then be like, “oh my god, I have so little time left, and my boss needs a presentation today.” When you’re in a position like this, you will probably make bad decisions.

    Self Preparation For Great Decision Making

    As you can see, we are surrounded by an environment that can significantly influence how we are making our decisions. And this environment is not helping us to make the right decisions in our life. So we have to be smart about how we are going to tackle this by the needed skill of decision-making.

    Decisions must go in line with your goals.

    When you have to make a decision, you should think about how this decision will impact your goals. Making a decision that is not in line with your goals will turn out to be a disaster because it will contradict your beliefs and restrict you from achieving your goals.

    For example, If you want to play football, and that is your goal, then picking up any other sports will contradict your ultimate goal. You also need to think about your physical condition. So when you’re deciding how to spend your spare time, you should consider how to include some physical activity in your plan. 

    Small decisions make a huge impact. 

    Self Decision Making

    Firstly, All these things are big huge decisions that we make in our life, like what career path to choose or in which university to study and when it’s true that these decisions matter. 

    We often forget about little daily decisions that add together and make a massive difference in our life. If you look around, you will notice that these small decisions and actions lead to extraordinary results.

     If you write a blog, you will not be successful with one viral post. Yes, you might gain a boost in traffic, but that will not guarantee you success. What will ensure your success is the decision to write daily and post consistent content over extended periods.

    Deciding to eat at Mc Donald’s will leave a harmful impact on your goal if you are trying to lose some weight. If you want to build some muscle, then skipping a gym session is not a good idea.

    These are tiny decisions that have a small impact on the goal. But repeated over and over will result in you never achieving your goal.

    Take yourself out of the situation. 

    As I mentioned above, One of the biggest challenges in making decisions is that people tend to make emotional decisions. And the decision that is made in an emotional wave is probably not the right decision.

    A great technique is to imagine that you’re not in a situation by yourself. But you’re advising your best friend. This way, you have all the reasons to make the right decisions for your friend, and you will not be emotional because you are not in that situation. 

    For example, I have started a new business, and six months later, I find myself struggling with everything. I have problems with my team, it’s hard to manage, and they are not getting along well. 

    My product is having some issues, and I’m getting bad feedback from my customers. At that time, sales are quite bad as well. So I start to think if I should keep going or just quit and do something else. 

    If I want to make a decision, I will be very emotional when I am in this situation. But what I can do to make a better decision is to imagine that my best friend is in this situation and give him advice about what to do.

    When I look at the situation without emotions, then I will be able to make a much better decision. Another great thing is that I use myself quite often is making just good enough decisions. When you want to make a perfect decision, you will always overthink and over the plan, which will lead to procrastination.

    Remember that all the decisions that you make can be changed. As you grow your knowledge and experience, you will improve your decisions to better ones.

    Conclusion

    In conclusion, We can do self-preparation for making the right decision. In the future decisions are become complicated, to grow your business. So, we need to improve our decision-making skills over some time. 

    In this blog, you can read the 3 things on self-preparation for decision making, which is related to your goals, small decisions, and take yourself out of the situation.

    Also you can read our blog on How To Learn RISK IMPACT AND PROBABILITY CHART

    FAQ’s

  • How To Learn RISK IMPACT AND PROBABILITY CHART

    How To Learn RISK IMPACT AND PROBABILITY CHART

    Introduction

    Earlier, we discussed that there is risk in every corporate decision, and the impact hits every business directly on its bottom line.

    The activities of every organization involve risk. So, it is necessary to remove or reduce the likelihood that occurred in the project. Therefore, risk analysis is an essential part of risk management to identify the risks and control them. 

    Especially, qualitative methods and quantitative methods are necessary to complete the risk analysis. By using qualitative methods, we can investigate, classify, and determine the risk involved in the project. The performance of the quantitative risk analysis is carried out after the qualitative risk analysis.

    The Cost, safety, operation, and quality are the factors which affect the risk analysis.

    WHAT’S IN IT

    What is Risk 

    Risk Impact

    Firstly, There are various types of uncertainties found in the organization which is known as risk. This risk will affect the growth of the organization at the time of work or completion of work. So, implement the risk management and risk analysis to reduce or remove the risk that occurred in the project. 

    Therefore, Risk management is a four-step process that includes risk identification, risk analysis, risk response, and risk monitoring and controlling.

    In this case, Risk impact and probability are the functions of risk analysis. Determine the risk impact and risk probability by using qualitative and quantitative methods.

    Risk Impact probability charts 

    Two main components of risk analysis are impact and probability. The impact of the risk may be positive or negative. This impact is caused due to uncertainties that occur in the project.

    A combination of impact and probability can determine the level of risk.

    Impact and probability matrix is ​​a simple method to estimate the risks and allocate resources. 

    Three categories of the impact of risk are: low, medium or high. The risk is always has a negative effect.

    However, the size of the impact varies in terms of cost, health, and other essential factors.

    The probability of a risk is express or classify in the same way as the probability of 0% to 100%.

    Here, Risk impact/ probability charts provide a useful framework for low to high risk.

    Let’s see, the impact probability chart. The impact and probability chart represents the risk that occurred in the project. However, The chart matrix will measure the probability of occurrence along the vertical axis from low to high.

    Similarly, On the x-axis, we measure the impact risk from low to high. The decision-makers need to know about the dangers that are included in the project and the impact on the organization. You can give priority to each risk so that it provides a clear view of risk impact.

    Low impact/low probability    

    Risk Impact

    Those risks are having a low probability of occurrence, and little impact of risk is indicating in the bottom left corner of the chart. So, This risk is not essential to take action.

    However, You can record risk in the risk register. This record used in future monitoring and controlling.

    Low impact/high probability 

    Those risks are having a high probability of occurrence, and little effect of uncertainty is indicating in the Top left corner of the chart. So, This risk is medium essential to take immediate action.

    However, you should try to reduce this risk, because this risk includes the combination of small risks that create a high impact in the future. 

    High impact/low probability 

    Those risks are having a low probability of occurrence, and the high impact of risk is indicating in the bottom right corner of the chart. This risk is highly significant to take immediate action.

    However, you should try to remove or reduce this risk. To identify this risk, you should try to estimate the risk and make a risk assessment analysis.

    High impact/high probability 

    Those risks are having a high probability of occurrence, and the high impact of risk is indicating in the top right corner of the chart. This risk is most important to take immediate action.

    However, you should try to remove this risk before it occurs. To identify this risk, you should try to estimate the risk and make a risk assessment analysis. This risk requires the priority to take action. 

    Risk Mitigation 

    After the completion of risk identification, risk measurement, or risk quantification, the process of risk mitigation takes place.

    The risk has negative Impacts and adverse Impacts, and when they should required steps are initiated to reduce this adverse impact, so that strategy is called risk mitigation.

    Four strategies of Risk Mitigation.

    • Avoid or withdraw 
    • Reduce or optimize
    • Share or transfer 
    • Accept or retain

    1) Avoid or withdraw 

    Avoid or withdraw means, In a critical situation, do not undertake that activity which carries risk.

    What will be the implication of this strategy?

    • The exposure to risk will be avoided, altogether, so there will be zero risk
    • The loss of business opportunity is damaging to the organization.
    • All business organizations need a profit for sustaining themselves; hence if we do not undertake activities that carry risk, then there will be a loss of potential profit.
    • Avoidance is maybe a costly strategy. Therefore this cannot be adopted.

    2) Reduce or optimize

    Reducing or optimizing means, reducing the severity of the impact. 

    The impact of undertaking an activity can be positive, or it can be harmful, and risk is associated with a negative impact.

    So, In this is a strategy, the focus is on how to reduce that negative impact.

    These can be done by optimizing the risk. So, This optimization of risk can be done by balancing the negative impact and the benefits which will be available from undertaking that activity.

    3) Share or transfer 

    Risk Impact

    Sharing or transferring means, sharing the burden of loss or benefit of gain from risk with other parties.

    For example: 

    In the lending business, it can be through:

    • insisting on the higher-margin that is sharing with borrowers
    • collateralizing on tangible is sharing with borrowers
    • transfer of risk by obtaining guarantees from credit grantee organizations 
    • Securitization is to reduce concentration and recycling

    4) Accept or retain

    when the cost of management of risk through other options is very high, or it restricts the achievement of organizational goals then risk retention will be the best strategy.

    Once it is decided to retain the risk, then the decision will be taken to manage the risk.

    It is a good strategy where the chances of very large loss are too small and the cost to share or transferring the risk is very high.

    Here, Risk acceptance or retention helps in the growth of business and profits. You can also use another strategy.

    In conclusion, no one is the best strategy, so these are strategies have to be used through a mix.

    Conclusion 

    In summary, You will see that risk impact and probability chart are an essential part of decision making. Risk analysis is a significant part of risk management to identify the risks and monitor this risk.

    Various types of risk should be found on the organization, Which creates a considerable impact on the organizations. Impact and probability matrix is ​​a simple method to evaluate the risks.

    You can learn to give priority to the threat, which depends upon impact and probability. You can see the risk mitigation and four strategies of risk mitigation.

    Also you can read our blog on All You Need To Know About Risk Analysis And Risk Management.

    FAQ’s 

  • All You Need To Know About Risk Analysis And Risk Management.

    All You Need To Know About Risk Analysis And Risk Management.

    Almost every decision regarding business involves risk. Therefore, Risk is the probability of something going wrong and leading to negative results, if it does. Sometimes this is small, and sometimes it’s large, and the result can be severe. 

    That is why weighing up a risk before you make a decision is so important. If you understand it well, you will be much more prepared to handle it.

    WHAT’S IN IT

    What is Risk Analysis and Risk Management?

    Firstly, You can design risk analysis and management process to help the organizations avoid or reduce the risks.

    Risk analysis and management is the process of identifying the risk of harming projects. 

    Risk analysis is a lengthy process because you need to get information such as planning, accounting, marketing, and other relevant information. 

    However, it is an important planning tool, which can save time, money, and fame.

    Steps of Risk Analysis and Risk Management

    Risk analysis

    Conducting a risk analysis is the best way to make sure your decisions are reliable and well-considered.

    Risk Assessment and Management 

    Firstly, get information from the heads of departments and their managers. Risk assessment is the first way to start recording specific risks or threats in each department. Collecting the necessary information is a significant step in the risk assessment process.

    The risk management structure is designed to find out the project risk at the beginning of the project.

    Risk Identification

    Firstly, you must identify your threats. They may have come from anywhere. For example, what happens if your computer system fails? What if a team member becomes ill? or what if the primary supplier disappoints you? Make a note of these and spend enough time identifying everything that might go wrong.

    Use the following suggestions to identify the risks.

    Risk Sources

    Risk repository, checklist, Expert judgment, and project status are sources of risk identification. These sources provide the following data

    • The list of risks identified in completed projects.
    • Checklist of risk identification questionnaires.
    • Interview with experts and stakeholders.
    • To know the project status from the information collected through meeting reports, progress reports, and quality reports.

    Risk category

    The type of risk events is provided in the risk category. Some of the categories of risk are technical, external, organizational, and project management. This category includes the data collected from technology, performance, customers, market, logistics, budget, planning, and estimation.

    Analyze the Risk

    Once you have this list, you need to evaluate it to assess the value of each risk. Multiply the probability of each event and how much it will cost to set things right. It gives you value for each chance.

    Therefore, the Probability of risk measures from low expectation to high likelihood of risk occurrence.

    Similarly, calculate the impact of the risk, which is from low to high.

    The time in which this risk will affect will be determined. This time should be near or far, which is count in months. Classify this timeframe risk according to project guidelines. It is also necessary to describe the cost, schedule, scope, and quality effects based on the risk’s nature.

    Action Plan for Risk

    There is no other way to reduce the risks of the project. Manage the different types of risk strategically in the long run. Therefore, To develop an action plan to minimize the risks.

    These action plans should include the risk description with risk assessment. It should also include information about taking action to reduce the risk. All risk planning should be assigned to the person identified to maintain the action plan.

    Make the record of each risk in the register with the permission of shareholders in agreement. These records should be check and confirmed by the manager.

    Especially, The trigger indicates that risk has occurred in the past, and it should retake the place. The trigger detects risk or warning signs. Make a record of all triggers in the register.

    The project manager is responsible for managing all the risks in the project.

    Manage Your Risk

    Risk analysis

    Next, you need to manage significant risks, and there are several ways to do this. Ask yourself, ‘Is there anything I can do to eliminate them? What assets can I use to deal with them? And Can I come up with a contingency plan to minimize their effects?

    The main goal of risk analysis and management is to apply the necessary precautions and reduce the risks. To start with a high priority, fix or mitigate each risk so that it is easy to remove threats. The project manager is responsible for managing all the uncertainty in the project.

    Once you’ve completed your risk analysis and worked out how you will handle inverse events, you will want to carry out frequent reviews. 

    Risk Monitoring and Control

    It means that you need to check your risk analysis from time to time to ensure that nothing has changed. Also, you will check your systems and plans regularly. 

    Formal risk analysis is useful when you have to make a significant decision because it helps you analyze the threats you are facing and come up with plans to deal with them. 

    Risk review is a repetitive process that uses progress reports and delivery status to monitor and control risks. It includes quality reports, progress reports, follow-up reports, and various status reports beyond that.

    Qualitative Risk Analysis

    The quantitative or qualitative are the two main approaches to risk analysis. The Qualitative risk analysis usually involves assessing the probability of a risk arising based on subjective characteristics and using predefined ranking criteria that have an impact on the organization. The effect of a threat is usually divided into three categories: low, medium, or high. The probability of a risk is expressed or classified in the same way as the probability of 0% to 100%.

    Classifying risks in this way can help organizations and project teams determine which risks can be considered the lowest and which should be strictly controlled to minimize the impact on the business or project.

    Qualitative risk the analysis gives good results because it collects data from customers in the risk analysis process based on perceptions of the potential risks.

    Quantitative Risk Analysis

    Risk analysis

    The most thoughtful inputs and random variables are included in the risk model.

    The risk model is created using the simulation statistics to assign numerical values to the risk. The evaluation of the project risk in quantitative risk analysis is usually performed after a qualitative risk analysis. The Quantitative risk analysis analyzes the chances of each threat, and its results numerically.

    The goal of quantitative risk analysis is to associate a certain amount for each risk, representing the potential cost to the company if that risk occurs.

    Therefore, a quantitative risk analysis can be done by the organization. The company affected by the data breach can quickly determine the financial impact of the event on its actions. 

    The organization gets more objective information from quantitative risk analysis than qualitative risk analysis. Thus, it helps to make the best decision-making process.

    Conclusion

    In conclusion, Risk management has become extremely challenging in project management. While we cannot predict the future, we can implement a systematic and straightforward risk management process to find uncertainties in projects and reduce the risk. 

    Risk management not only helps to prevent risk but also helps to learn from past mistakes. So, That improves the chances of successful project completion.

    That is not the whole process of risk management. It is a continuous learning process that can improve and increase our process efficiency.

    Also you also read our blog on Prospect Theory- An analysis of decision under Risk and Uncertainty

    FAQ’s

  • Learn All About Quantitative Strategic Planning Matrix (QSPM)

    Learn All About Quantitative Strategic Planning Matrix (QSPM)

    Introduction

    In summary, QSPM is a high-level strategic management approach. The Quantitative Strategic Planning Matrix (QSPM) has not only been used in strategic management but is also used in marketing strategy.

    However, QSPM gives the best suitable analytical technique by comparing it with other different actions. So the QSPM helps to make a strategy formulation analytical framework.

    WHAT’S IN IT

    What is a Quantitative Strategic Planning Matrix (QSPM)?

    Firstly, the Quantitative Strategic Planning Matrix is a method to choose the perfect technique by comparing it with its different best possible techniques. So, The best strategy selected by using computation techniques and management techniques.

    Also, the QSPM methodology falls inside presumed ‘stage three’ of the strategy formulation analytical framework.

    Stages of Strategic Management Tools

    Stage 1

    In the first place, the analysis gives the inputs to the QSPM matrix. So, The first step in the strategic management analysis is used to identify key strategic aspects.

    For example, this can be done using the IFE matrix and the EFE matrix.

    Stage 2

    In stage 2 analysis, Accordingly match the inputs of stage 1 to the outcomes from stage 2. After identifying and analyzing key strategic factors as inputs to QSPM, we can design the type of strategy, we want to follow.

    So, This can be done by using stage 2 strategic management tools. For example; SWOT analysis, SPACE matrix analysis, IE matrix, or BCG matrix model.

    In Stage 2, Strategic Tools provides information needed for the QSPM installation. So, The QSPM method allows the evaluation of alternative strategies.

    Stage 3

    Finally, In this stage, We choose the best strategy from alternative strategies. So, compare QSPM alternative strategies and decide what is best to achieve the goals.

    Therefore, The relative attractiveness of each strategy is calculated by determining the cumulative effect of each external and internal critical success factor.

    Steps to construct QSPM

    Particularly, The main goal of the QSPM matrix is to select the right strategy to move forward which is based on the available information.

    If you want to build your QSPM to make accurate decisions to solve the problems, consider the following steps.

    Step 1: IFE  – Internal Factor Evolution

    Firstly, To begin the process of building a QSPM, you will make a list of the strengths and weaknesses of your organization.

    Also, Completing a few points under the strengths and weaknesses will give you a good start in your matrix. So remember, that at this point, you are only dealing with considerations within your organization.

    Step 2: EFE – External factor Evolution

    Similarly, you are now looking for opportunities and threats outside of your company in the market. Earlier, The new market is expanding outside the organization which creates potential opportunities and difficulties for the competitors.

    However, threats can create strong competition, and the market price can be lowered.

    Finally, These opportunities and threats that you have identified should be listed below on the left side of your paper.

    Step 3: Strategy Alternatives

    When all your internal and external factors have been identified, now the next process is to outline the strategies. So, These are the strategies you will choose by using a complete matrix.

    Specifically,  All the strategies should be listed at the top of the matrix that you have considered. You must have at least two options to play, but you can choose more options. So, You will need three columns – weight, attractiveness score, and total under each strategy option.

    Step 4: Weighting the Factors

    Afterward, For each of the factors you include in your matrix, you must assign a weight. Weight is going to give importance to each factor, so you should take the time to think about how much each factor influences in practical application.

    Therefore, The weights of your external factors and internal factors should be up to 100%. When done, you should weigh under each of the proposed strategy options. Since different strategies have different importance on your various factors, it makes sense to have a different weight for each option.

    Step 5: Attractiveness score

    Similarly, As you did with the weight, you are now going to provide an attraction score for each factor internally and externally.

    Specifically, These scores will be on a scale from 1 to 4, where 1 is not attractive and 4 is most attractive.

    Therefore, If the factor in question does not affect the choice you make, you can consider the attraction score to be zero.

    Go through the whole matrix you have created, until all your factors are weighted and attractive.

    Step 6: Final Calculations

    Lastly, To complete the QSPM process, you will perform the necessary calculations to stabilize the final values ​​in all your alternatives.

    The calculation is very simple – you are going to multiply the weight by the attractiveness score, and then you are going to add this score to each column.

    So, You can compare the total with each alternative which is available in the matrix.

    the best overall option is the highest total score should be considered.

    Example of QSPM

    Quantitative Strategic Planning Matrix For XYZ company

    Quantitative Strategic Planning Matrix

    QSPM – advantages and disadvantages

    Advantages

    1) A set of strategies can be considered simultaneously.

    2) Both relevant factors are integrated into the decision-making process

    Disadvantages

    1) Need sensible judgment and assumption.

    2) The performance of QSPM depends on the initial input from previous stages.

    3) Evaluate only strategies related to each other in a given set.

    Conclusion

    Finally, After doing some simple calculations in QSPM, we conclude that finding a competitive organization is a good option. So, This is given by the sum of the total attractiveness score.

    The acquisition strategy scores higher than the internal expansion strategy. 

    Also you can read our blog on Prospect Theory- An analysis of decision under Risk and Uncertainty

    FAQ’s

  • What is Decision Tree and why is it important

    What is Decision Tree and why is it important

    Would it be a good idea for me to buy a Netflix subscription or Amazon Prime videos subscription? or Should I eat chicken or veggies? I should be watching Football on ESPN or WWE on Ten Sports?  We take the majority of the choices quickly and at times we require some time to get to pick which alternative we need to go dependent on our premonitions. This is alright. You can’t settle business choices dependent on your premonitions. Since one wrong choice can end your business in only one second. This is why management people need some decision-making tools to make the right decision at the right time. One of the most prominent decision-making tools is the Decision Tree.

    WHAT’S IN IT

    What is Decision Tree

    According to medium.com, a decision tree is a tool that takes help from a tree-like diagram or model of decisions to reach the potential results, including chance event results, asset expenses, and utility. It is one approach to show an algorithm that just contains contingent control proclamations. 

    A decision tree is a flowchart-like structure in which each internal node represent a “test” on quality (for example regardless of whether a coin flip comes up heads or tails), each branch speaks to the result of the test, and each leaf node speaks to a class name, i.e the decision was taken after computing all characteristics. The ways from the root to leaf speak to classification rules. 

    Terms used in the studies of the Decision Tree

    Root Nodes

    It represents the whole population or test sample and this further gets separated into at least two homogeneous sets.

    Splitting

    It is a procedure of separating a node into at least two sub-nodes.

    Decision Node

    When a sub-node separates into further sub-nodes, at that point it is called the Decision Node.

    Leaf Node

    A Leaf node is that type of nodes that do not split further, mentioned as a Leaf Node.

    Pruning

    At the point when we evacuate sub-nodes of a decision node, this procedure is called pruning. You can say the inverse procedure of splitting.

    Branch

    A branch is a subsection of the whole tree.

    Parent and Child Node

    A parent node is a type of node, which is isolated into sub-nodes and is called a parent node, while sub-nodes are the child nodes of the parent node.

    Types of Decision Trees

    Two principles categorize decision trees depending on the target variable, i.e., categorical variable decision trees and continuous variable decision trees.

    Categorical Variable Decision Trees

    A Categorical Variable Decision Tree incorporates exact target factors that are partitioned into categories. For instance, the categories can be yes or no. The categories imply that each phase of the decision making procedure can be categorized as one of the categories, and there are no in-betweens. 

    Continuous Variable Decision Trees

    A Continuous Variable Decision Tree is a decision tree with a constant target variable. For instance, the salary of a person whose pay is obscure can be anticipated dependent on accessible data, for example, their occupation, age, and different consistent factors.

    Explanation of Decision Tree

    Let’s take two examples. You have two business ideas, one is a candy shop and another is a lemonade stand. You can earn up to $100 with the candy shop option and up to $90 with the lemonade stand option. Which option would you choose? The answer is easy, the candy shop.

    DECISION TREE

    Let’s make it a little more complex. What if, the candy shop has a 50% chance of success and a 50% chance of failure. If you become successful you will earn $100 and if you fail you will lose $30.

    On the other hand in the case of the lemonade stand, you also have a 50% chance of being successful and a 50% chance of getting failed. Here, if you get the success you will earn, $90 but if you fail you will only lose $10.

    DECISION TREE

    The answer seems to be quite difficult now. But actually, it’s not. You have to use a simple formula. In the case of the candy shop, you have a 50% chance of earning $100 and a 50% chance of losing $30. Add, 50% of $100 with 50% of -$30 and you will get a value of $35. We call it an “expected value.”

    Let’s apply the same formula for the lemonade stand. Add 50% of $90 with 50% of -$10. The expected value, in this case, is $40.

    Clearly, the expected value of the lemonade stand is higher than that of the candy shop. You should go with the higher expected value.  But what is the meaning of the “expected value? If you implement the lemonade project many times in exactly the same situation then there is a high chance that your average earnings will be $40 per time.

    Applications of the Decision Tree

    • Variable selection

     The quantity of variables that are routinely observed in clinical settings has expanded dramatically with the upliftment of electronic data storage. A significant number of these variables are of peripheral pertinence, and subsequently, not remembered for data mining exercises.

    Like stepwise variable determination in regression analysis, decision tree techniques can be utilized to choose the most important Input variables that ought to be utilized to frame decision tree models, which can in this manner be utilized to plan clinical hypotheses and inform subsequent research. 

    • Assessing the relative importance of variables

     Once a lot of applicable variables are recognized, analysts might need to know which variables have a major role. For the most part, the variable significance is dependent on the decrease of model exactness when the variable is empty. As a rule, the more records a variable affects, the more prominent the importance of the variable. 

    • Handling of missing qualities

    A typical – however wrong – strategy for taking care of missing data is to prohibit cases with missing qualities; this is both wasteful and risks presenting bias in the analysis. 

    Decision tree analysis can manage missing data in two different ways: it can either characterize missing qualities as a different category that can be broken down with the other category or utilize a built decision tree model that set the variable with a lot of missing values as a target variable to make an expectation and supplant these missing ones with the predicted value. 

    • Prediction

    This is one of the most significant utilization of decision tree models. Utilizing the tree model got from verifiable data, it’s quite easy to predict the result for future records.

    Conclusion

    The Decision Tree has revolutionized the studies in the field of decision making since the 1960s. Although there are a lot of decision-making tools, like the Conjoint analysis, Decision matrix, Pareto analysis, very few are as accurate as the decision tree model. Today, this tool is playing a major role in modern computer learning and algorithm.

    Also You can Read our blog on Paired Comparison Analysis- A tool for Decision Making

    FAQ’s

  • What is Pareto Analysis- A detailed explanation

    What is Pareto Analysis- A detailed explanation

    A business is all about making choices! Some of them can help a business grow super-duper fast, and some of them make a business sink. Hence, an entrepreneur must have good decision-making skills. But making business decisions can be tricky, which is why entrepreneurs use some statistical and mathematical rules to make better decisions. One of those rules is the Pareto Analysis.

    Now, without further introduction, let’s dive into a detailed explanation.

    WHAT’S IN IT

    What is Pareto Analysis?

    Pareto Analysis is a statistical technique to choose the best possible answer to a problem from several probable answers.

    During the second world war, Austrian-American business consultant Joseph Juran, for the first time suggested the term ‘Pareto Analysis’, though it’s named after the Italian socio-economist Vilfredo Pareto, who in the 1890s observed that 80% of Italy’s gross wealth used to come from 20% of its land.

    PARETO ANALYSIS

    Pareto’s Principle is a universal rule. Let’s see some of its most prominent examples,

    1. In B2B, 80% of the profit is generated with the help of 20% of its customers.
    2. In offices and factories, 80% of the work is done by 20% of the employees.
    3. 80% of the crimes are committed by 20% of the criminals.

    Pareto’s 80/20 rule is not as accurate as the laws of Physics, but it’s based on observation and till today it is observed that 80% of the events are caused by 20% of the causes.

    How to make a Pareto Chart?

    There are a few different ways to implement the Pareto Analysis, and they are based on the same basic rule.According to Mind Tools, there are 6 steps to conduct a Pareto Analysis,

    1. Identify the problems- Make a list of the problems you have to resolve.
    2. Identify the causes- Find and list the causes behind every single problem.
    3. Score the problems- Based on the need to resolve the issues, give them a point. Suppose you have listed down 3 problems, 
    4. Grey hair
    5. Hair fall
    6. Split end

    Now, here the biggest problem is hair fall. So we will give it 3 points. The second biggest problem is the Split end. Let’s give it 2 points and finally give Grey hair 1 point.

    • Group all the problems- Make a group of your problems based on the problems behind them. 
    • Add points- Give points to the cause groups. The group with the top score signifies the highest priority, and the one with the lowest score signifies the lowest priority.
    • Actions- Start fighting the top priority problem first.

    Graphical representation of Pareto Analysis

    Let’s understand how to present the Pareto Analysis in Graphical Form. First, divide the score of every individual problem by the total score of all the problems and then calculate the percentage by multiplying by 100.

    Now, draw a chart with one horizontal axis and two vertical axes. Put 0 to the total problem score from bottom to the top along the left axis. On the other hand, put 0 % to 100% from bottom to top along the right vertical axis.

    PARETO ANALYSIS

    So, The length of each bar must relate to the value on the left axis and the total percentage on the right axis. Now let’s start accumulating these. Start making a curve from the first bar. The curve starts to rise quickly, but then it starts tapering off because the percentages of a problem bar get smaller. 

    So, It’s time to apply the Pareto principle to the graph. Now start to draw a straight line from that 80% mark towards the curve horizontally and then draw the line downwards from the point where it meets the curve.

    Hence, The whole diagram is now in two parts, one is Vital Few, and the other is Trivial Many or Useful Many.

    When to use Pareto Analysis?

    Earlier we have seen some of its examples. Whether you are optimizing code, trying to improve the workflow, or trying to do quality improvements Pareto’s chart can be helpful everywhere.

    Beginning of Quality Improvement Process

    So, Pareto Analysis is utilized toward the beginning of a round of quality improvement to make sense of what business issues are liable for the most objections or misfortunes and commit improvement assets to those. 

    For instance, pioneers at one organization accepted that most of the client grievances included defective products. When they saw the grievance information in a Pareto Analysis, it indicated that a lot more individuals complained about delivery delays. Maybe the authorities of the company were more cautious in resolving problems due to the defective products. however, more clients were influenced by transportation delays, and the organization’s priority was better committed to take care of that issue.

    Later in Quality Improvement Process

    Hence,  Even after facing the basic challenges like the one we discussed in the previous point, big companies face many other big issues that require their attention to get resolved.

    So, On the previous point, we mentioned that the company identified that the biggest problem was shipping delays.

    Hence, Again the company has to use the Pareto Analysis to understand the biggest cause resulting in the shipping delay.

    Other than the Quality Improvement process

    So, The Pareto Analysis is implemented to resolve a lot of other issues as well. hence, Like, suppose you are a student, and you are not scoring good marks. You can also use the Pareto Analysis to identify why you are not scoring good marks.

    Conclusion

    Hence, The Pareto Analysis is not as accurate as of the Laws of Force or Laws of Attraction, or any other kind of Physics laws. But it’s still better than making big decisions based on gut feelings. Almost a century after its origin, it is still relevant. Widely known as the 80/20 law it helps executives in taking risky decisions and point out the top priority errors to make their services and products better.

    Also You can read our blog on Prospect Theory- An analysis of decision under Risk and Uncertainty

    FAQ’s

  • Conjoint Analysis- A detailed overview

    Conjoint Analysis- A detailed overview

    Humans face easy to complex choices each day, For Instance, which restaurant should I visit today? or which car should I buy? etc. Hence, Most of these choices are very easy to make and never potentially harm us if we choose this or that. But, when it comes to business, making choices can be trickier. A wrong decision can make a business go bankrupt, whereas a good decision can help a business grow like nothing else. In business, we would love to somehow get inside our customers’ brains, and get a quantitative report.

    Well, Conjoint Analysis does this.

    WHAT’S IN IT

    What is a Conjoint Analysis?

    Conjoint Analysis is a popular research method for predicting how people make complex choices. So, The conjoint analysis or stated preference analysis is a statistical technique that originated in mathematical psychology. Also, It is used in social science and applied science, even marketing product management and operations research.

    Paul Green, a marketing professor at the Wharton School at the University of Pennsylvania, developed it further from its basics originated from mathematical psychology. Another person who greatly contributed to the theory at later stages is V. Srinivasan, professor at Stanford University.

    Today, well over 10000 studies are being conducted annually on this tool by research firms, government agencies.

    How does it work

    Simple Example

    CONJOINT ANALYSIS

    Let’s assume you go to a shop to buy a smartphone or MP3 player. Now the salesperson tells you you can either get the model with the 32 gigabytes off the shelf at that moment or you get a model with 64 gigabytes. But then you have to wait one week for the delivery. 

    So, Now the question is, what is your preference? Your preference for one of the alternatives will reveal the part-worth utilities of individual attributes. In our example, attribute-1 is the memory size, and attribute 2 is the delivery time.

    According to BPMSG, “In a Conjoint analysis, the Part-Worth Utilities of individual attributes are calculated based on the selection or ranking of a defined set of combinations of attribute values.”

    When you choose the first model with 32 gigabytes, it will show that you put a high emphasis on the short delivery time. Choosing the second model will reveal your high emphasis on the large memory size. 

    So in a conjoint analysis, the part-worth utilities of individual attributes in our case memory size and delivery time are calculated based on the selection of all rankings of a defined set of combinations of attribute values. 

    Complex Example

    Let’s take our example a little more complex. We take into consideration 3 attributes. Then, we look at the color, green or red. Finally, we look at memory size, 16 or 64 gigabytes and we look at the delivery time, one day or one week. 

    Combining all attributes with that individual values will result in 8 different combinations. 

    In order to solve this problem with the mathematical methods, we code the values or levels with minus one and plus one each. So, for example, the green is coded as minus one, and the right is coded as plus one. 

    Here is the list of combinations with their coding. We call it the design metrics. Fork attributes, there are two to the power k possible combinations. Using all possible combinations is called a full factorial design. 

    We treat the 3 attributes as variables each of them with the value of minus one or plus one. 

    Graphical Representation

    In a graphical illustration, each combination is represented as a point in a corner of a cube. 

    CONJOINT ANALYSIS

    One dimension of the cube shows the colour, the second shows the memory size and the third the delivery time. 

    The next step in a conjoint analysis is to ask the person for a ranking of the possible combinations, for example, to give 1 for the most preferred combination going down to 8 for the least preferred combination. 

    Then we use a simple linear model function to describe the ranking and to find the part-worth utilities. 

    The ranking is expressed as part of attribute one, color, multiplied by the level for attribute one minus one or plus one, plus the part-worth of attribute two multiplied by the level for attribute two, plus part-worth of attribute three, multiplied by level for attribute three, plus a constant.

    CONJOINT ANALYSIS

    As a mathematical equation is shown here where better are the part-worth utilities. Now we can set up a system of linear equations using the coded combinations and the ranking for each combination given by the person. 

    This system of linear equations gets a solution with a multi valiant linear regression. For our simple example here we calculate the part-worth utilities in the following way. 

    Further

    To find the main effect for attribute one, the color, we take the average ranking for all model combinations with X 1 equals +1, which means the red color, and subtract the average ranking for all combinations with X 1 equals -1, that means green color. 

    CONJOINT ANALYSIS

    In our cube, it corresponds to the sum of ranking values for all points on the right side of the vertical plane minus the sum of ranking values of all points on the left side of the vertical plane.

    We divide by 4 as we take the average of 4 points each and set it concerning the total variation of the X value from minus one to plus one so we divide by 2. 

    As a result, we get a part-worth utility for the colour of -0.5. In the same way, we proceed for the other 2 dimensions. 

    As a result, we get the wanted part-worth utilities for color, memory, and delivery time. The ranking calculated with the model function fits exactly the actual ranking. To calculate the relative preference for each attribute we have to look at the total range of variations for our level equals to -1 and +1 which is 7 in our example. 

    So for the attribute color, we get a relative preference of 1 over 7 or 14 percent. For memory, 4 over 7 of 57 percent and for delivery time 2 over 7 or 29 percent. 

    Uses of the Conjoint Analysis

    Since the development of Conjoint Analysis in the 1970s, it was a bridge between psychology and mathematics. Few of its many uses are,

    Product Testing 

    Decision-based conjoint analysis is generally for testing the intrigue of items and services. 

    For instance, a new drink, a new cabin in an aeroplane, or another public transport system(hyperloop). 

    Hence, by introducing the different characteristics of the other options, it urges individuals to think through the trade-offs. We get a more profound comprehension of why individuals make decisions. 

    Understanding Psychology

    The decision-based conjoint analysis is used to recognize which traits individuals see as being generally significant, which is helpful to know for knowing what the buyers are looking for and companies can optimize their products and services likewise.

    Conclusion

    After over half a century of it, development of this decision-making tool is still widely relevant.

    To conclude, conjoint Analysis has linked two completely different streams of science, Psychology, and Mathematics, and helped marketers and companies a lot in placing their products and services more accurately.

    Also You can read our blog on Recognition Primed Decision (RPD)-For complex situations

    FAQ’s

  • Analytical Hierarchy Process-Detailed guide?

    Analytical Hierarchy Process-Detailed guide?

    Don’t you think that our “tomorrow” lies in the decisions we are making today? Throughout our entire life, we make choices, sometimes based on 2 criteria and sometimes based on more. The process of decision making based on multiple criteria called MCDA or Multi-Criteria Decision Analysis. So, The Analytical Hierarchy Process is one of the most famous MCDM methods. But What is the Analytical Hierarchy Process? Let’s dive in without further introduction.

    WHAT’S IN IT

    What is Analytical Hierarchy Process 

    When you combine individual performance indicators to one key performance indicator you can give each one a different weight. Now the question is how to derive the weights, For this, a mathematical method is available which is called AHP, i.e. the Analytical Hierarchy Process.

    Also, The AHP or Analytical Hierarchy Process is an organized strategy for arranging and breaking down complex choices, based on arithmetic and brain research.

    As said in Wikipedia, in the 1970s Thomas L. Saaty suggested the AHP for the first time and revolutionized the studies of MCDM. Thomas L. Saaty, later partnering with Ernest Forman developed the Expert Choice in 1983.

    Calculation of the AHP

    The method is to derive ratio scales from paired comparisons. It also allows some small inconsistency in judgment. As an import, you can use actual measurements like price, weights, and so on or subjective opinions like satisfactory feelings or preferences, and as an output, you will get ratio scales and a consistency index. So, The method is based on the solution often an eigenvalue problem. The ratio scales result from eigenvectors and the consistency index from the eigenvalue. 

    The process is done in several steps. First, you have to define your objective, Then you have to structure the elements in groups of criteria, sub-criteria, and alternatives. In each group, you make a pairwise comparison of elements and calculate the weighing and consistency ratio. Then you can evaluate the alternatives according to the weighing and get a ranking. 

    Let us take an example. Your objective is to buy a gadget like a smartphone or MP3 player. The criteria are the colors of the model, the memory, and the delivery time. The colors pink, blue, green, and black are available. The memory space ranges from 8GB to 64GB and the delivery time is immediate or 5 days, or 4 weeks. 

    4 models are available as shown here. 2 models with a price of $120 and 2 models with a price of $150. These are your alternatives.

    Mathematical Representation of the AHP

    Now in the first step, you structure the elements in groups of criteria, sub-criteria, and alternatives. The objective is to buy the gadget and your criteria are color, memory, and delivery time. 

    To each criterion, you have sub-criteria, the color, the memory space, and the delivery times. You then have to compare all elements pairwise concerning the objective. So in the first step, you have to compare the criteria, color, memory, and delivery. 

    You start to compare the color with memory and you are using a scale ranging from 9 to 1/9. 1 means both criteria have the same importance and they are equal. 9 means criteria color is 9 times more important than memory. 1/9 means memory is 9 times more important than color.

    Analytical Hierarchy Process

    So let’s make the comparison. You compare the color with memory and in your opinion memory is 3 times more important than color so on the scale you will have 1/3. Then you compare the color with delivery you say delivery is 2 times more important than color then you get the result as 1/2. Memory and delivery are equally important in your opinion, so you put in a 1. For 3 criteria you have 3 comparisons. 

    Analytical Hierarchy Process

    In the next step, you’ll arrange your comparisons into a matrix as shown in this image. From this matrix, you compute the normalized principal eigenvector. 

    As a result, you get the following weighting. Colour- 17 percent, Memory- 43 percent ,and Delivery- 40 percent. 

    Analytical Hierarchy Process

    Further

    So the most important criteria are memory followed by delivery followed by color. Now you make the same pairwise comparison for the sub-criteria, in this case, the different colors. 

    Analytical Hierarchy Process

    For example, you compare the pink color and the blue color, you think pink is 2 times nicer than blue so you put a 2. Pink compared to green, in your opinion pink is being 3 times better than green and so on. 

    In total, because you have 5 criteria, you need to do 10 comparisons. Again you arrange the result of that comparison in the matrix and compute the normalized principal eigenvector of the matrix. As a result, you will get the percentages as shown here. 

    Analytical Hierarchy Process

    Now you’ll weight the sub-criteria according to the weights of the main criteria the complete results will look like this. The next step is now is to evaluate, the alternatives. We have available model 1, the color is pink and pink weights of 2.2 percent. The memory space of model one is 32 GB. 32 GB has a weightage of 19 percent. The delivery time is immediate. Immediate, as a result, get 18 percent. So after counting together you will get the first result of the benefit for model 1, i.e. 39 percent. You do the same for all of the models and then you would see that model 3 has the highest ranking.

    Analytical Hierarchy Process

    Probably you’ll notice that we didn’t put in the price of the models as one of the criteria. The reason is very simple, If you separate the benefits from the course we can do a cost-benefit analysis. 

    Graphical representation of the AHP

    You can draw a diagram showing the benefits as a function of the relative costs of the models. 

    So you’ll put in the models according to the benefits resulting from the analysis over the relative costs as it is shown here for models 1 to 4. Now let’s assume you have only selected model 1 or 3.

    As you can see, in the diagram model 3 has similar benefits compared to model 1 but with a higher cost. Probably you would go for model 1 with immediate delivery and a lower price. If only model 2 and model 4 would be available, then you can see that model 4  has significantly higher benefits than model 2, Probably you would go for model 4 accepting the longer delivery and higher price. 

    Uses of the AHP

    As opposed to recommending a “right” choice, the AHP enables decision-makers to discover one that best suits their objective and their comprehension of the issue. It gives an extensive and reasonable system for organizing a decision problem, measuring its components, relating those components to general objectives, and assessing alternative solutions.

    The users of the AHP first disintegrate their decision problem into a chain of command, i.e, the hierarchy of all the more effortlessly comprehended sub-problems, where each one can be analyzed individually. The components of the hierarchy can relate to any part of the decision problem.

    When the hierarchy is developed, the decision-makers methodically assess its different elements by contrasting them with one another two at once, as for their effect on a component above them in the hierarchy. 

    In conducting the comparison process, the decision-makers can utilize solid information about the components. It is the essence of the AHP that human decides, and not simply the fundamental data can be utilized in playing out the assessments.

    The AHP changes over these assessments to numerical values that can be prepared and looked over to the whole scope of the problem. A numerical weight or priority is determined for every element of the hierarchy, permitting assorted and frequently incommensurable elements to be contrasted with each other rationally and consistently. This ability recognizes AHP from other decision-making procedures.

    In the final step of the procedure, numerical priorities are determined for every one of the choices. These numbers represent the option’s relative capacity to accomplish the decision goal, so they permit a direct thought of the different courses of action.

    Decision circumstances to which the AHP is applied include: 

    Choice

    The choice of one option from a given arrangement of options, for the most part where there are various choice standards or criteria included. 

    Positioning

    Putting a lot of choices all together from most to least alluring. 

    Prioritization

    Determining the overall value of individuals from a set of choices, rather than choosing a solitary one or simply positioning them.

    Benchmarking

    Comparing the procedures in one’s association with those of other best-of-breed associations.

    Compromise

    Settling debates between parties with obviously contrary objectives or positions.

    The utilizations of AHP to complex choice circumstances have numbered in thousands, and have delivered results. Numerous AHP applications are never answered to the world everywhere because they occur at significant levels of enormous associations where security and protection considerations prohibit their revelation.

    Real-life Examples of AHP

    Experienced professionals realize that the ideal approach to comprehend the AHP is to work through cases and models. Two nitty-gritty contextual analyses, explicitly structured as inside and out showing examples, are given as informative supplements to this article: 

    Basic bit by bit example with four Criteria and three Alternatives: Choosing a pioneer for an association. 

    Increasingly intricate bit by bit example with ten Criteria/Subcriteria and six Alternatives: Buying a family vehicle and Machinery Selection Example. 

    Some portion of the books on AHP contains practical instances of its utilization. However, they are not normally expected to be step by step learning tools. One of them contains a bunch of extended models, in addition to around 400 AHP hierarchies quickly depicted and represented with figures. 

    Conclusion

    The AHP i.e. the Analytical Hierarchy Process is defined as an organized strategy for arranging and breaking down complex choices, based on arithmetic or brain research that has revolutionized the studies of Mathematics, Statistics, and Psychology since the 1970s.

    Its contribution to the modern studies of MCDM is considerable.

    Also You can read our Blog on Paired Comparison Analysis- A tool for Decision Making

    FAQ’s